
Fourth Quarter Financial Results: Amazon reported a 10% increase in net sales for Q4 2024, reaching $187.8 billion, up from $170.0 billion in Q4 2023. Excluding the impact of foreign exchange rates, net sales rose by 11%.
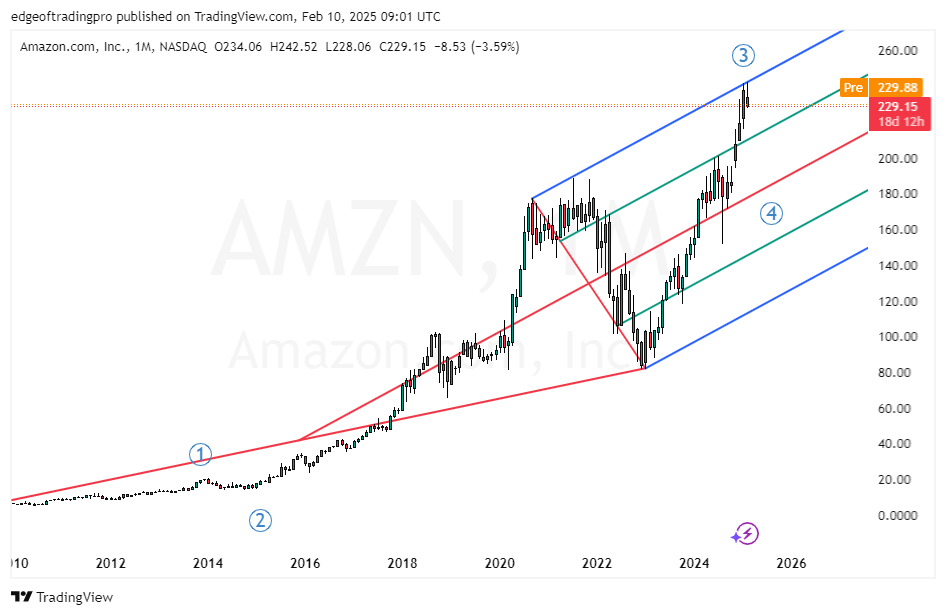
AMZN has recently been rejected from the 242 high 4 and is pulling back after the earnings report. This level represents a possible third long-term Elliott upside wave top; a confirmed break below 213 would confirm that. Only a break above 213 would lead to an upside continuation and invalidate the downside reversal. Learn to Trade Stocks profitably.
KNOWPO TRADING SYSTEM TRAINING INTRO FEE!
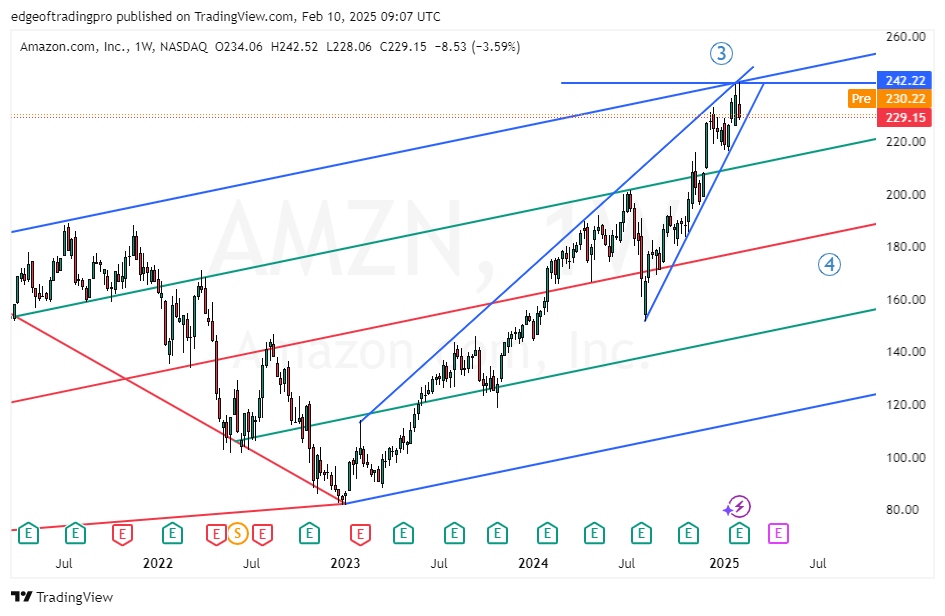
AMZN weekly chart below reveals a test of the uptrend channel resistance 242. At this point, sell positions have a greater probability of success. If we get a confirmed break below 228, we should see an acceleration of a reversal lower. The first target after a 228-level breakout will lead to a test of 200.
GET THE CHART OF THE DAY EVERY DAY IN YOUR INBOX
As the famous trader says…
“In trading and investing, patience is a virtue, panic is not.”
Peter Lynch
How to trade this?
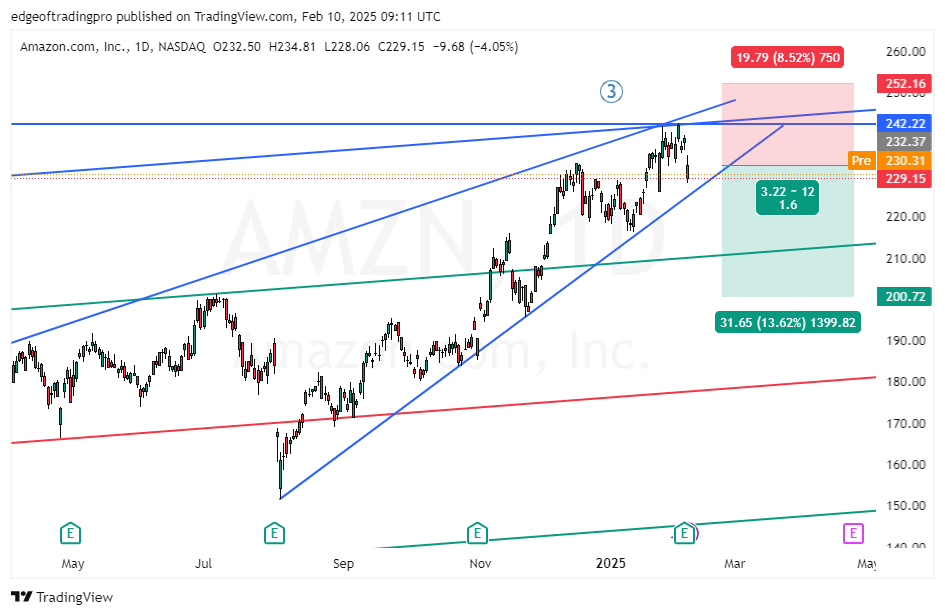
It is a fact that a strong downside resistance for Q1 2025 is 242 and If we get a confirmation of a breakout and a sustained extension below this level we could see still a strong downside continuation in the long-term third-wave correction. You can take the short trade here with a stop loss above 250. You can trade with put options as well. For inquiries about account management or copy trading please write to [email protected] or contact me on WhatsApp or Live chat.
OPTIONS TRADING TRAINING DISCOUNTED