
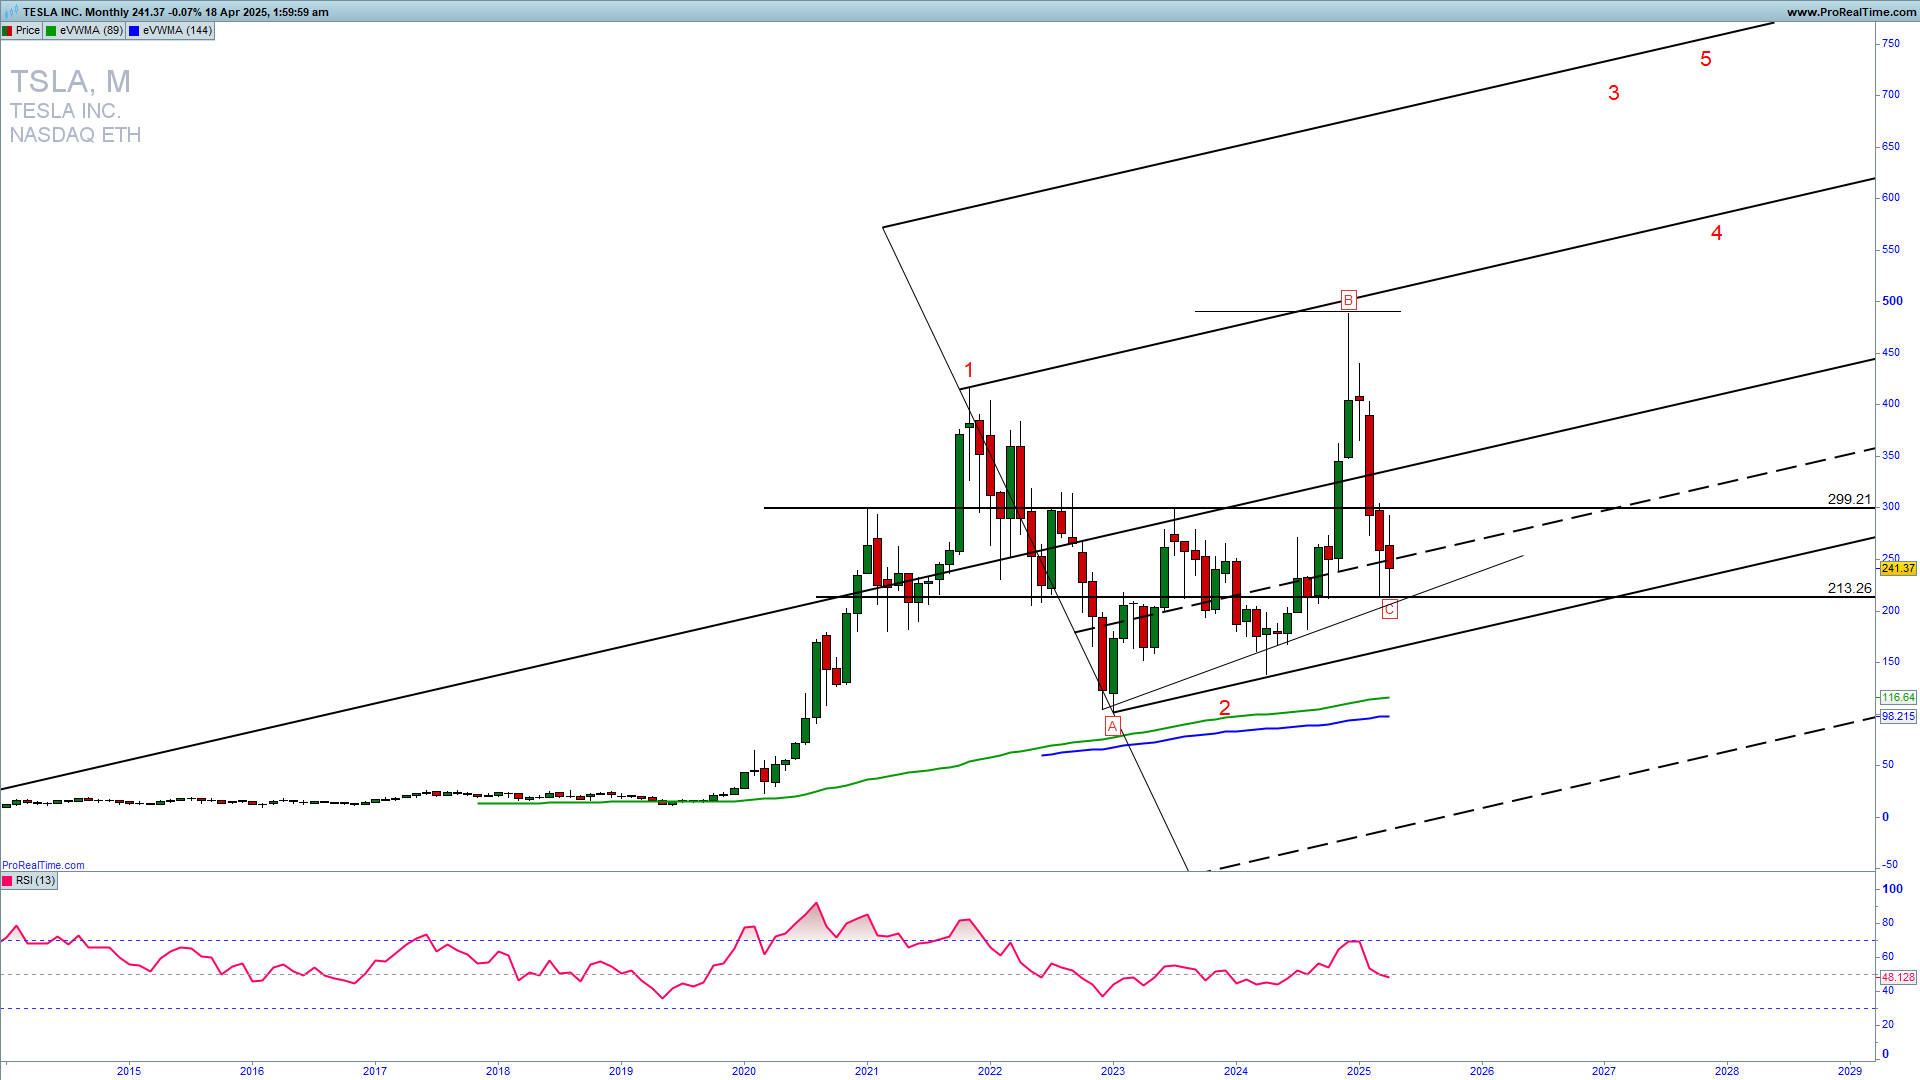
TSLA has recently fallen below 300 for the first time since November 2024. It tests the long-term support 213 level, uptrend line support, and the Andrews Pitchfork channel support. This still could be a pullback into a second long-term upside wave, as I expect an upside reversal from here in the longest third upside wave. Learn to Trade CFDs profitably.
KNOWPO TRADING SYSTEM TRAINING INTRO FEE!

TRADING PACKAGE EASTER SPECIAL OFFER
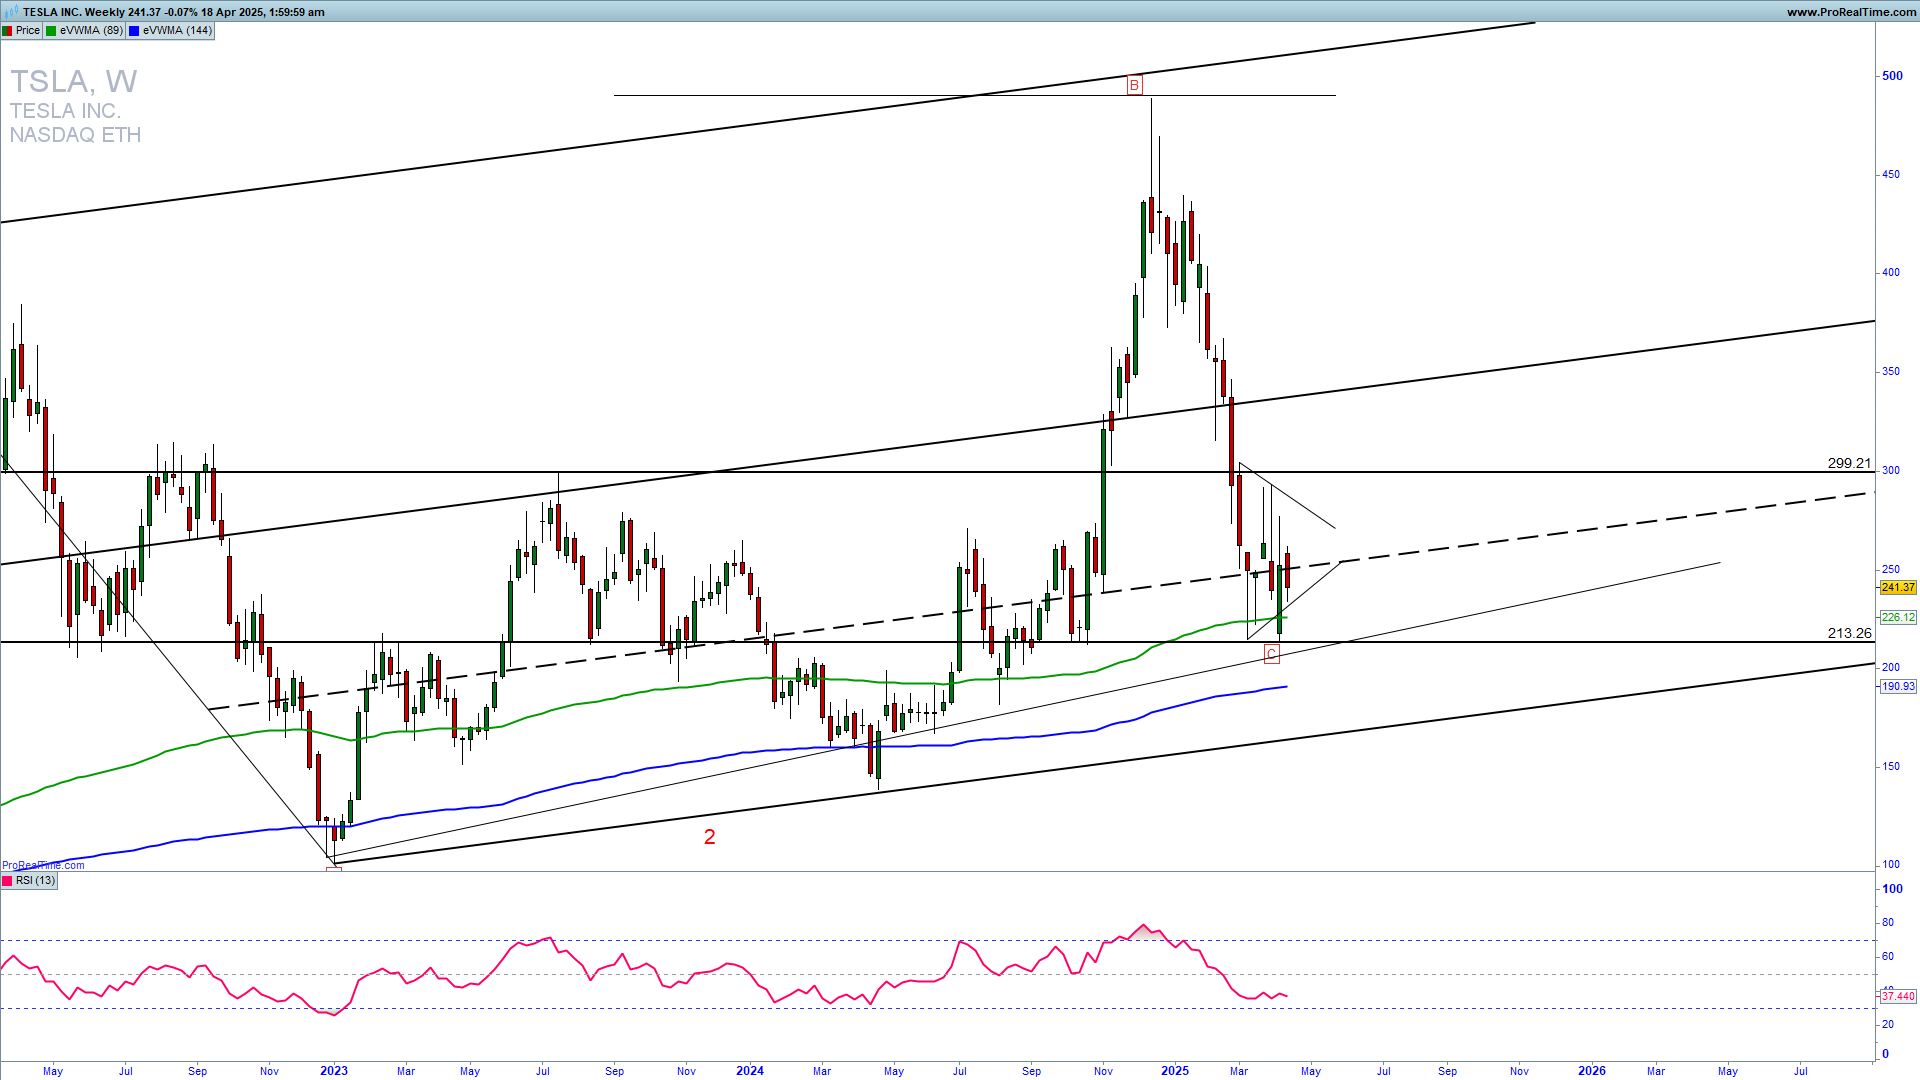
TSLA’s weekly chart below reveals a rotational triangle that is reaching the apex. Strong support now is 213. From here, I am looking at a possible swing higher to 280, which is the strong upside resistance of a triangle, and ultimately 300. Only a break below 200 will invalidate the upside reversal and a strong continuation higher.
GET THE CHART OF THE DAY EVERY DAY IN YOUR INBOX

How can we trade this?
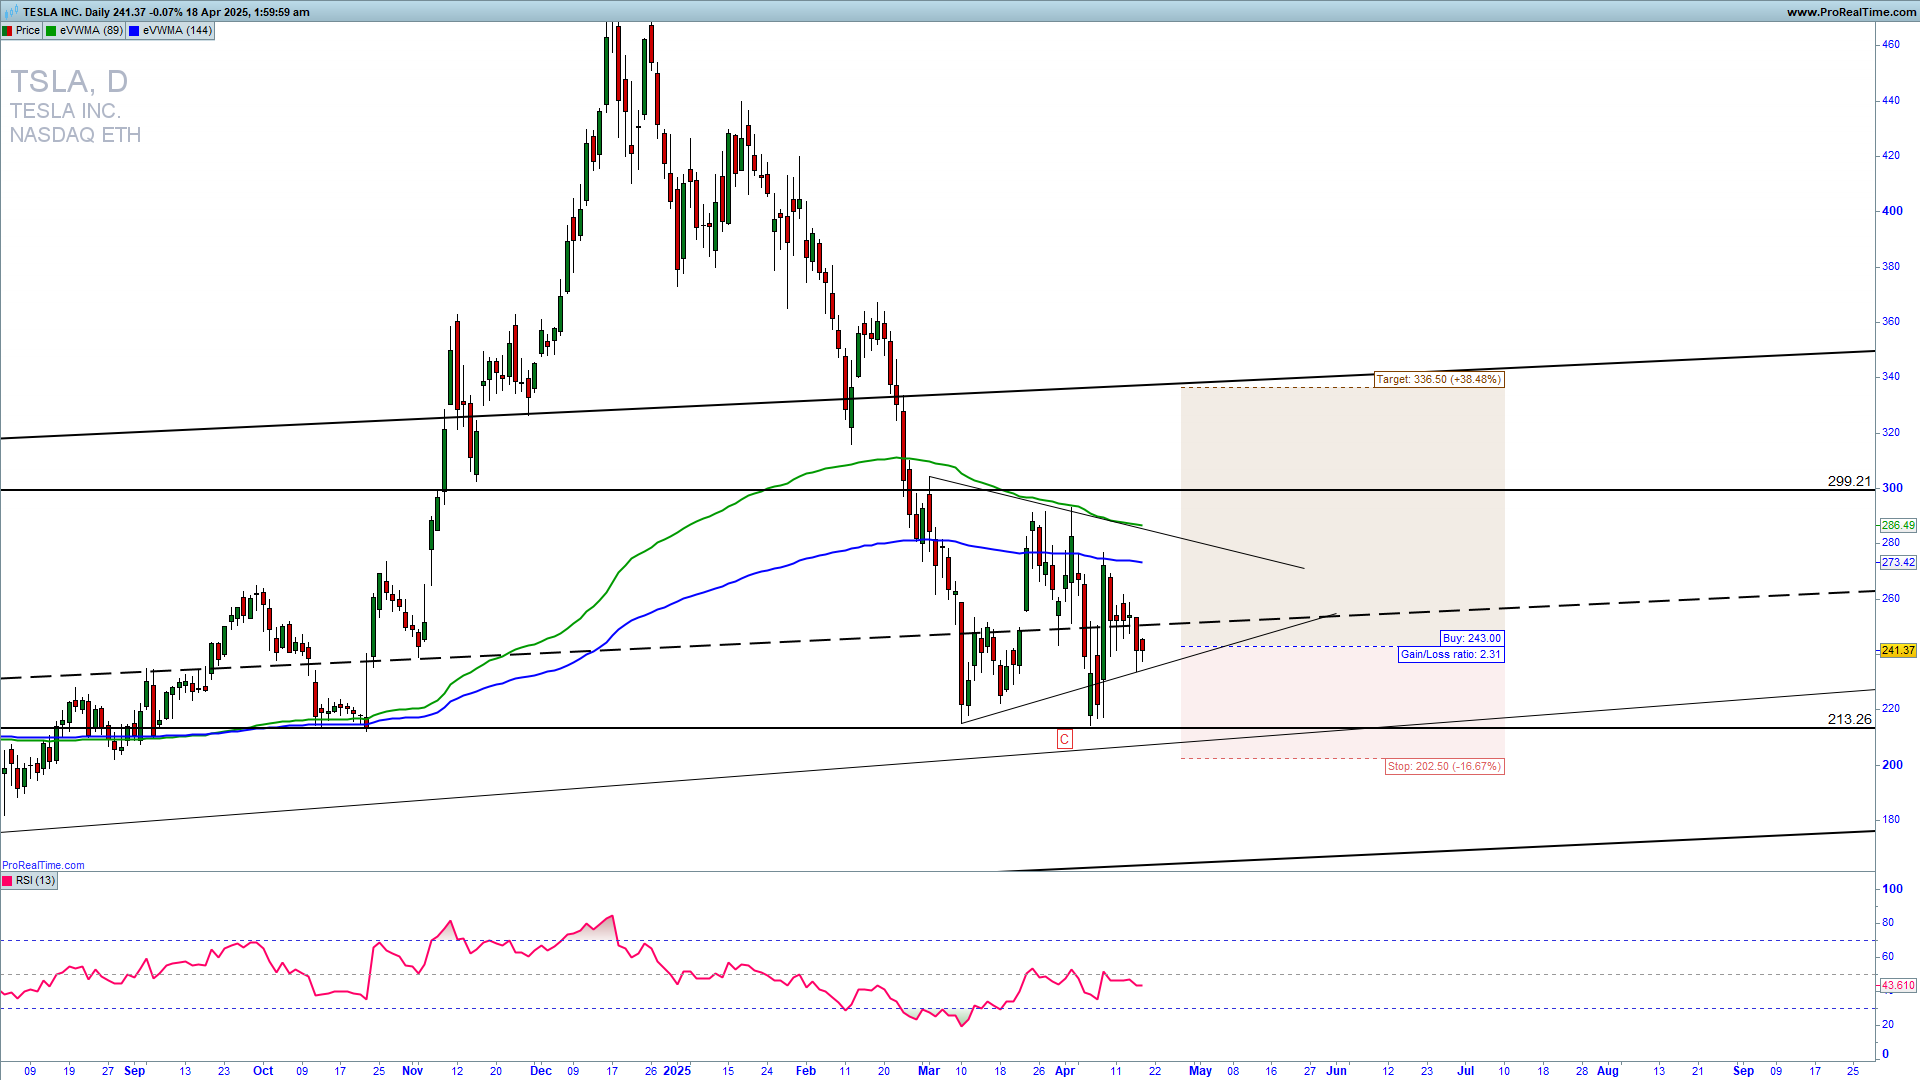
It is a fact that a strong upside resistance for Q2 2025 is 290, and if we get a confirmation of a reversal higher and a sustained extension above 260, we could see a strong continuation higher in the third long-term Elliott Wave. You can try with a long-trade entry with an SL below 210. You can buy call options as well. For inquiries about account management or copy trading, please write to [email protected] or contact me on WhatsApp or Live chat.
OPTIONS TRADING TRAINING DISCOUNTED