
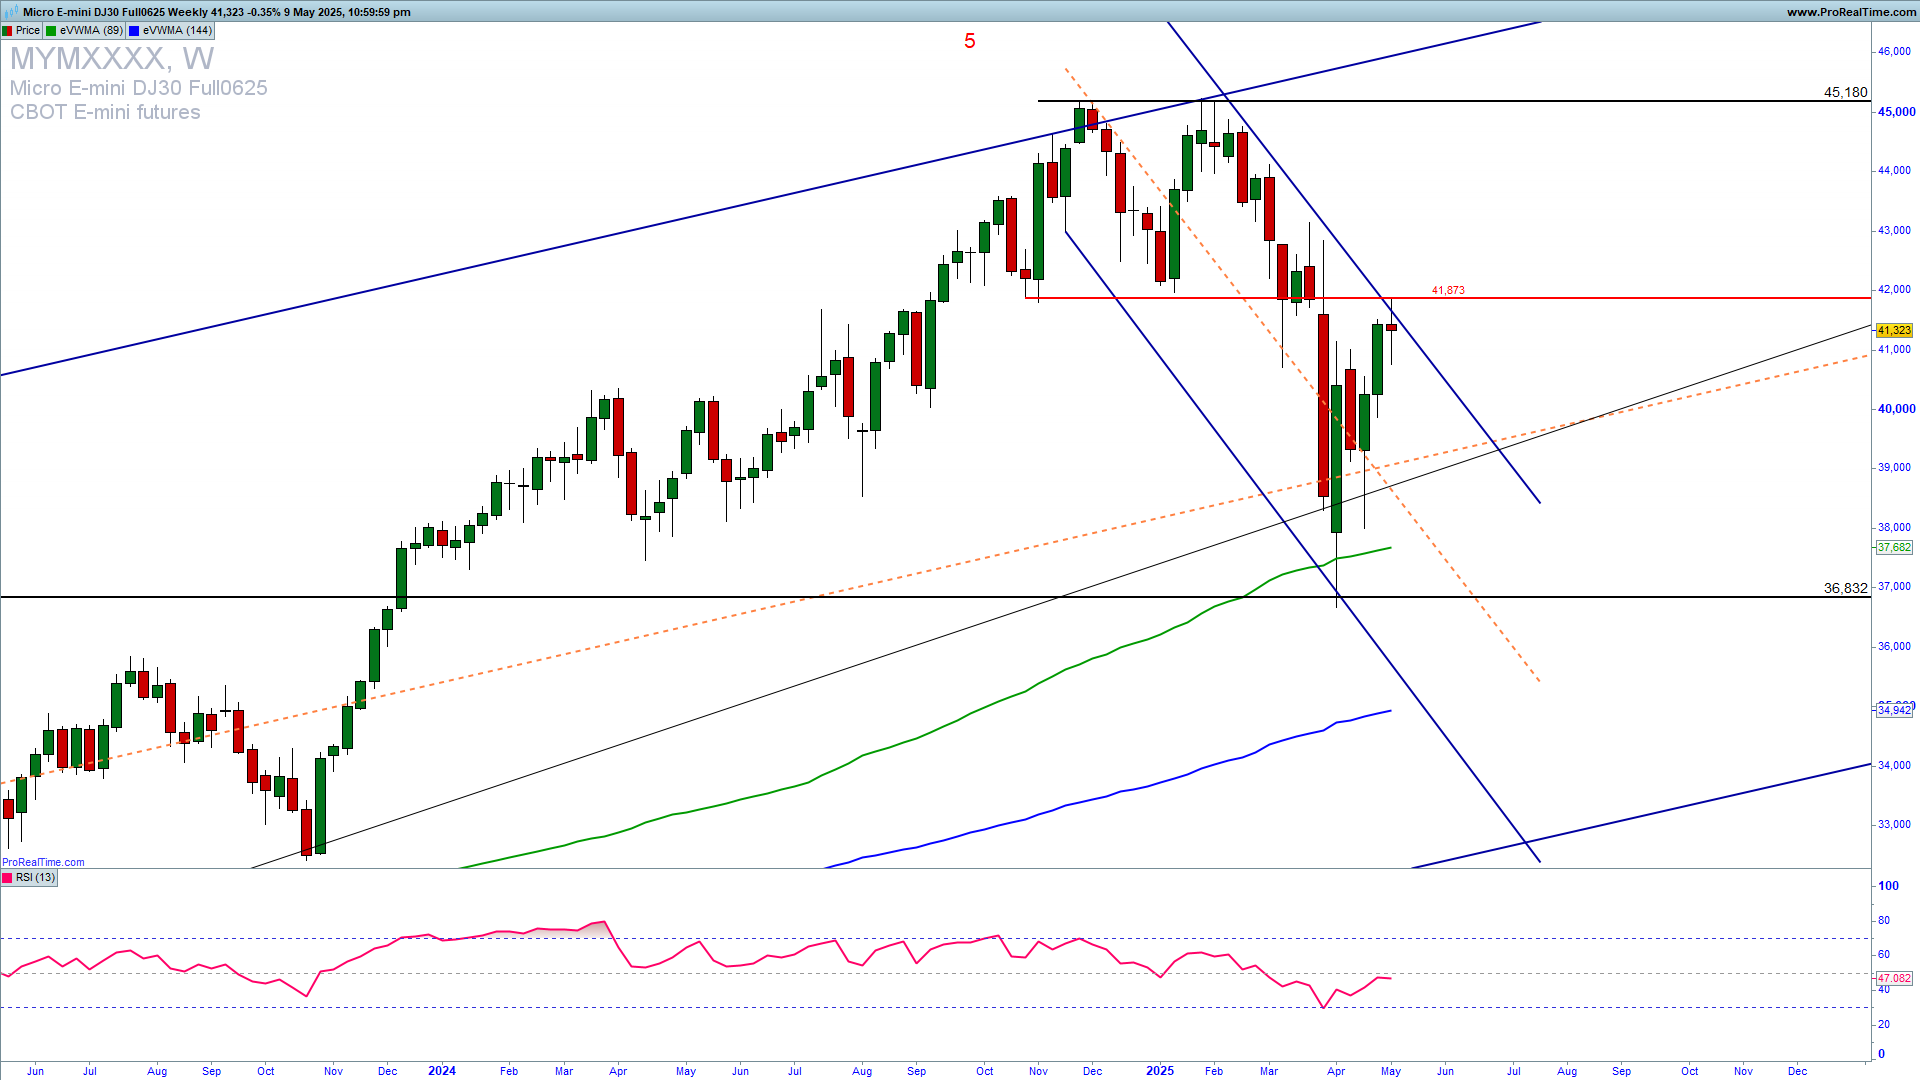
DJIA possibly reached the peak of a long-term five-wave pattern by touching 45150, as we can see on the monthly chart. The 36800 bounce contained a pullback from there. This bounce does not mean that the downside reversal is over. Learn to Trade Stocks profitably.

The DJIA weekly chart is revealing a falling channel with upside resistance of 41870. A break above this resistance is needed for an upside continuation to test a previous high of 45000. Rejection here or an overthrow with a break below 41800 will give us a good short trade entry. The following weeks and a price action above or below this level indicated are crucial for a long or a short trade.
GET THE CHART OF THE DAY EVERY DAY IN YOUR INBOX

How can we trade this?
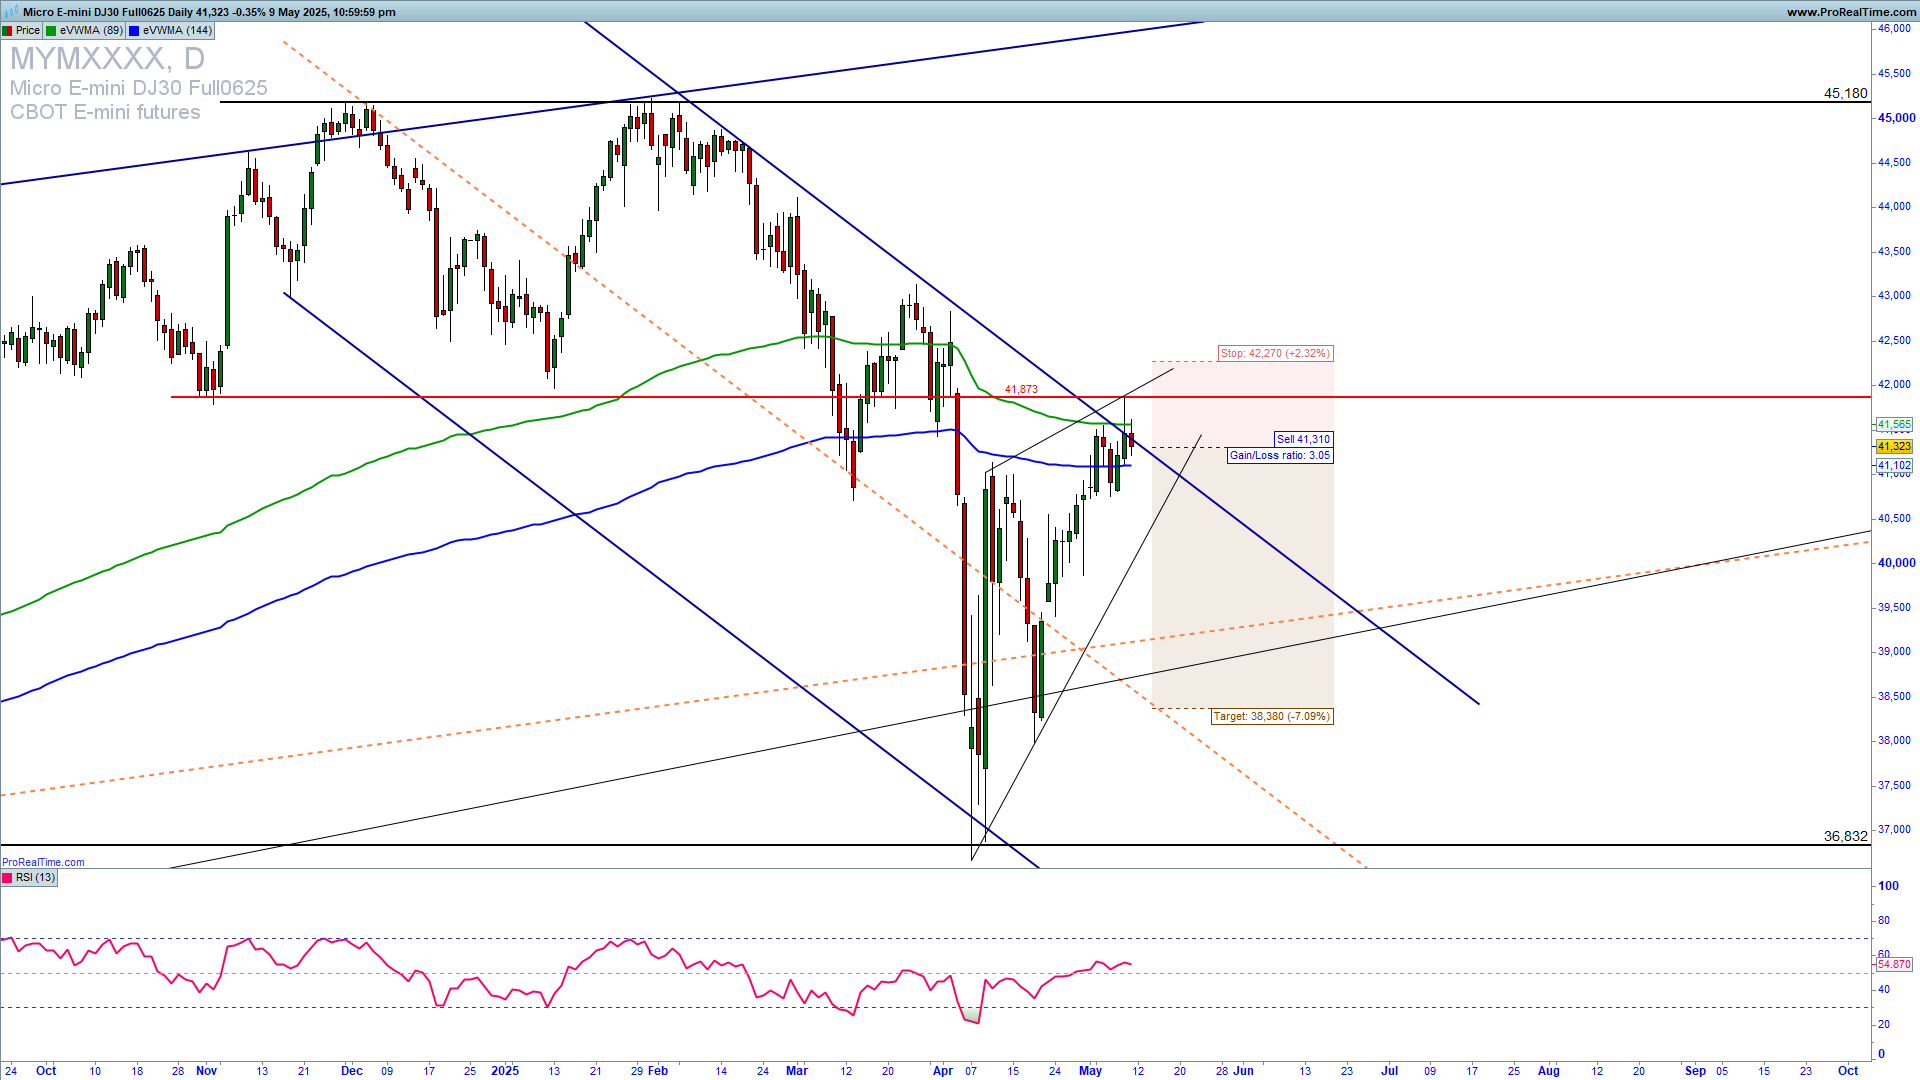
It is a fact that a strong upside resistance for Q2 2025 is 41850, and if we get a confirmation of a reversal higher and a sustained extension above it, we could see a strong upside continuation to 45000. You can try with a short-trade entry with SL above 42200. If the SL will be taken reverse to a long trade entry. For inquiries about account management or copy trading, please write to [email protected] or contact me on WhatsApp or Live chat.
OPTIONS TRADING TRAINING DISCOUNTED