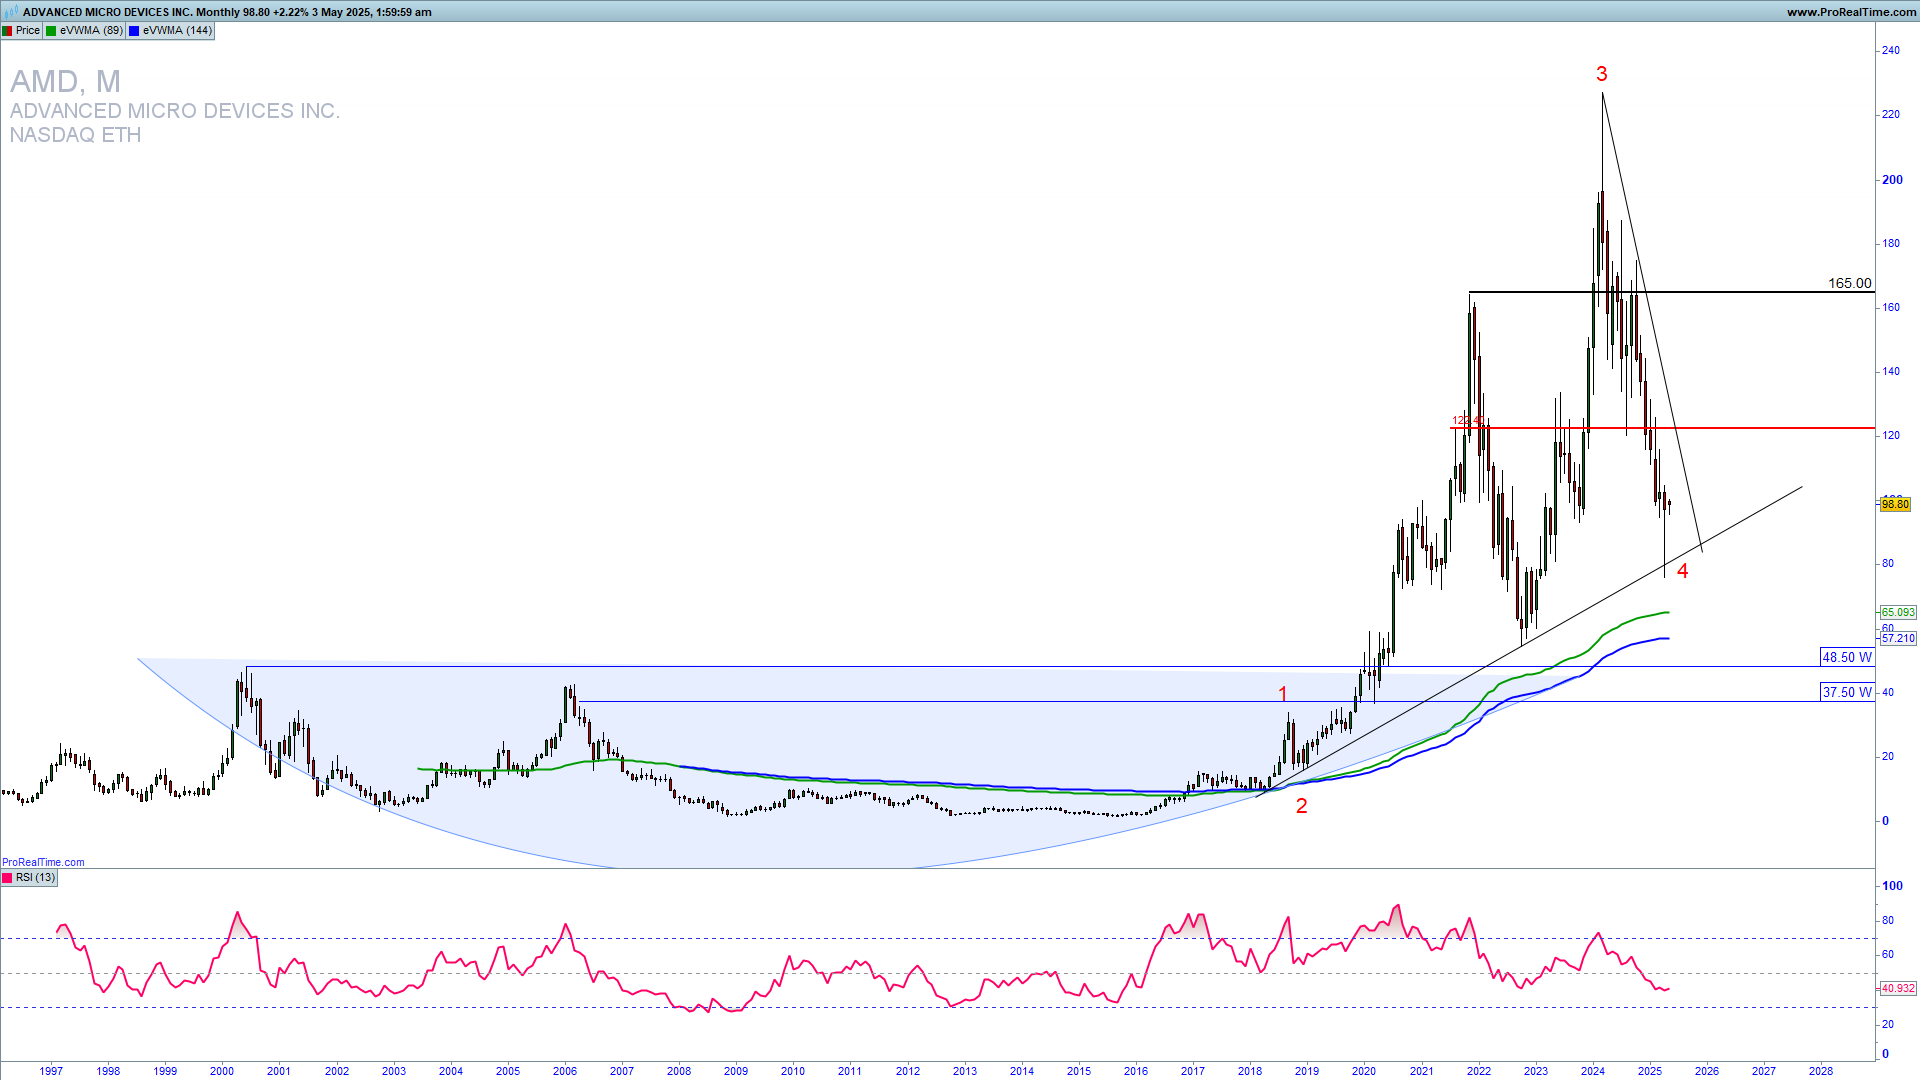
AMD reached a high of 230 and has pulled back since. We are seeing a bounce from 75, a recent uptrend line support. This could mark the end of the fourth wave long-term, but we could still see a consolidation ongoing before a meaningful reversal higher. Learn to Trade Stocks profitably.
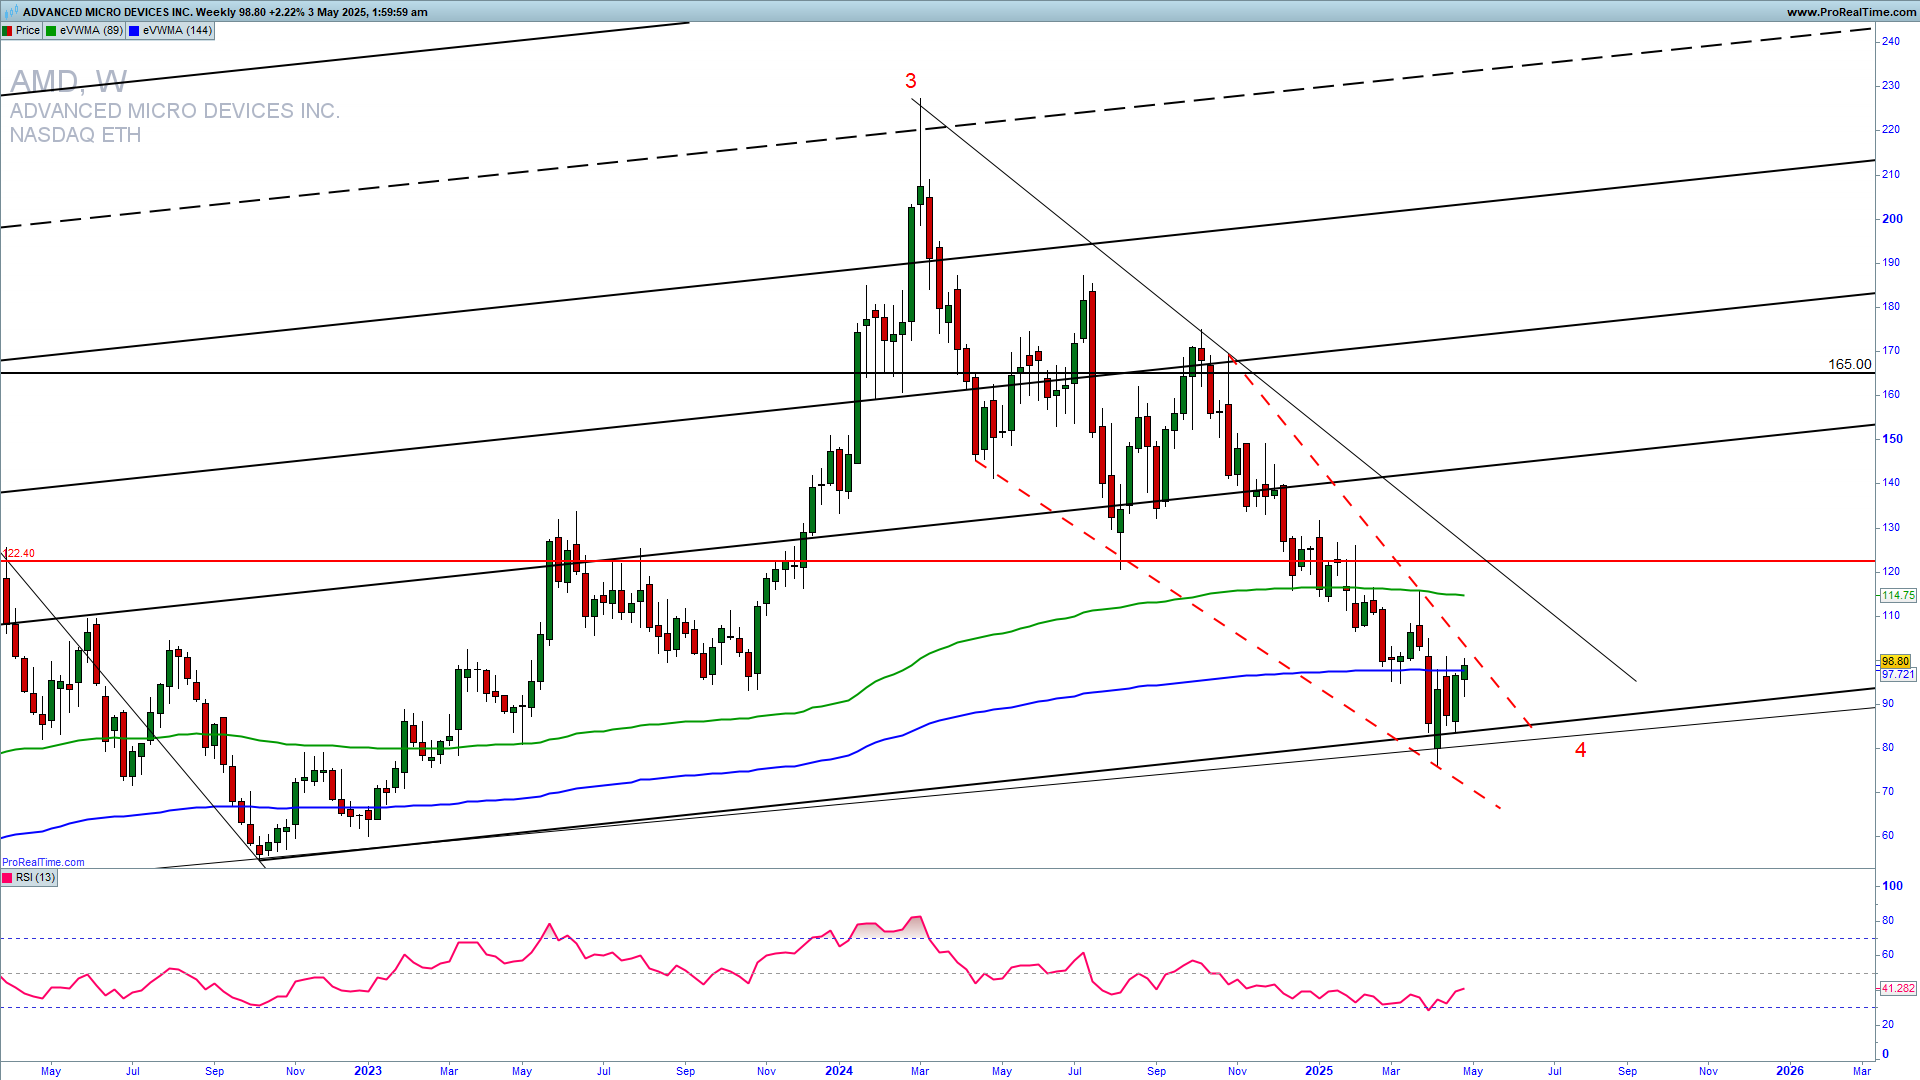
The AMD weekly chart is revealing a falling wedge with the most upside resistance now at 100. A break above 100 can lead to a test of the 115-120 zone, which can happen in the case of a good earnings report next week. A break above 120 will then mark a complete reversal higher with a huge upside potential, and a rejection from it can lead to a consolidation between 80 and 120.
GET THE CHART OF THE DAY EVERY DAY IN YOUR INBOX
How can we trade this?
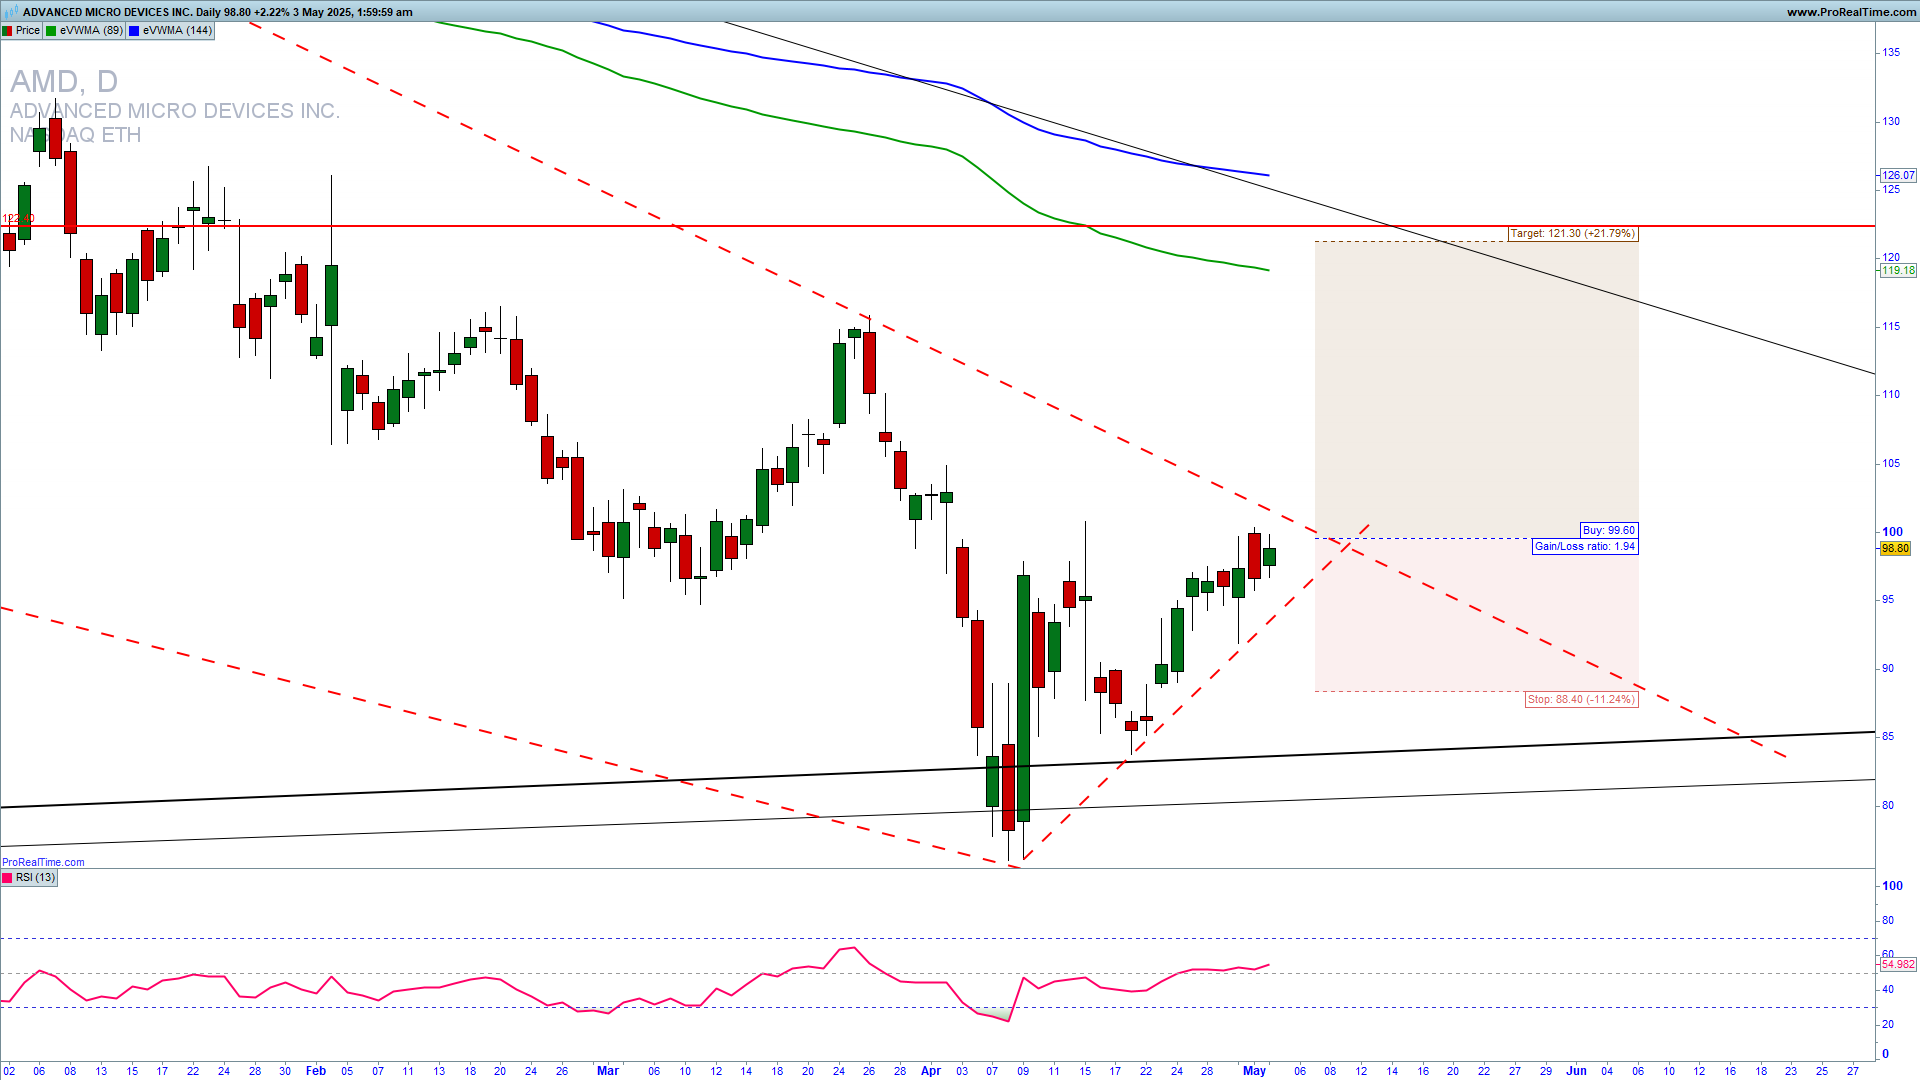
It is a fact that a strong upside resistance for Q2 2025 is 120, and if we get a confirmation of a reversal higher and a sustained extension above 120, we could see a strong upside continuation to 150. You can try with a long-trade entry ahead of earnings with an SL below 89. You can buy call options as well. For inquiries about account management or copy trading, please write to [email protected] or contact me on WhatsApp or Live chat.
OPTIONS TRADING TRAINING DISCOUNTED


