SPY is bouncing from the upside support

The SPY ETF, which tracks the S&P 500 index, has been caught in a turbulent market environment over the past few weeks. As of March 14, 2025, the S&P 500 entered correction territory, defined as a drop of more than 10% from its recent high on February 19, 2025. Reports indicate the index closed at 5,521.52 on March 13, down 10.1% from its peak of 6,144.15, reflecting broader market concerns. This downturn has directly impacted SPY, with its price dropping 1.4% over the past five days, though it remains up approximately 9.12% over the past year.
The market sell-off has been attributed to several factors, including uncertainty surrounding President Donald Trump’s economic policies, particularly his aggressive tariff proposals. On March 13, Trump threatened a 200% tariff on EU wines and spirits in response to the EU’s 50% tariff on US spirits, escalating trade war fears. This followed earlier tariffs on steel and aluminum, contributing to a $5 trillion loss in US stock market value over three weeks. The Dow Jones Industrial Average also fell nearly 900 points on March 10, with SPY and broader markets reflecting this volatility.
 

SPY has tested the 552 level and is bouncing from it. A break below 550 resistance will lead to a 470 test. We need to see a break above 560 for immediate relief and a continuation upside in the fifth wave. Learn to Trade Crypto profitably.

LEARN AND EARN TRADING BOOTCAMP WITH A FREE INSTANT FUNDED ACCOUNT!

SPY 15 days chart


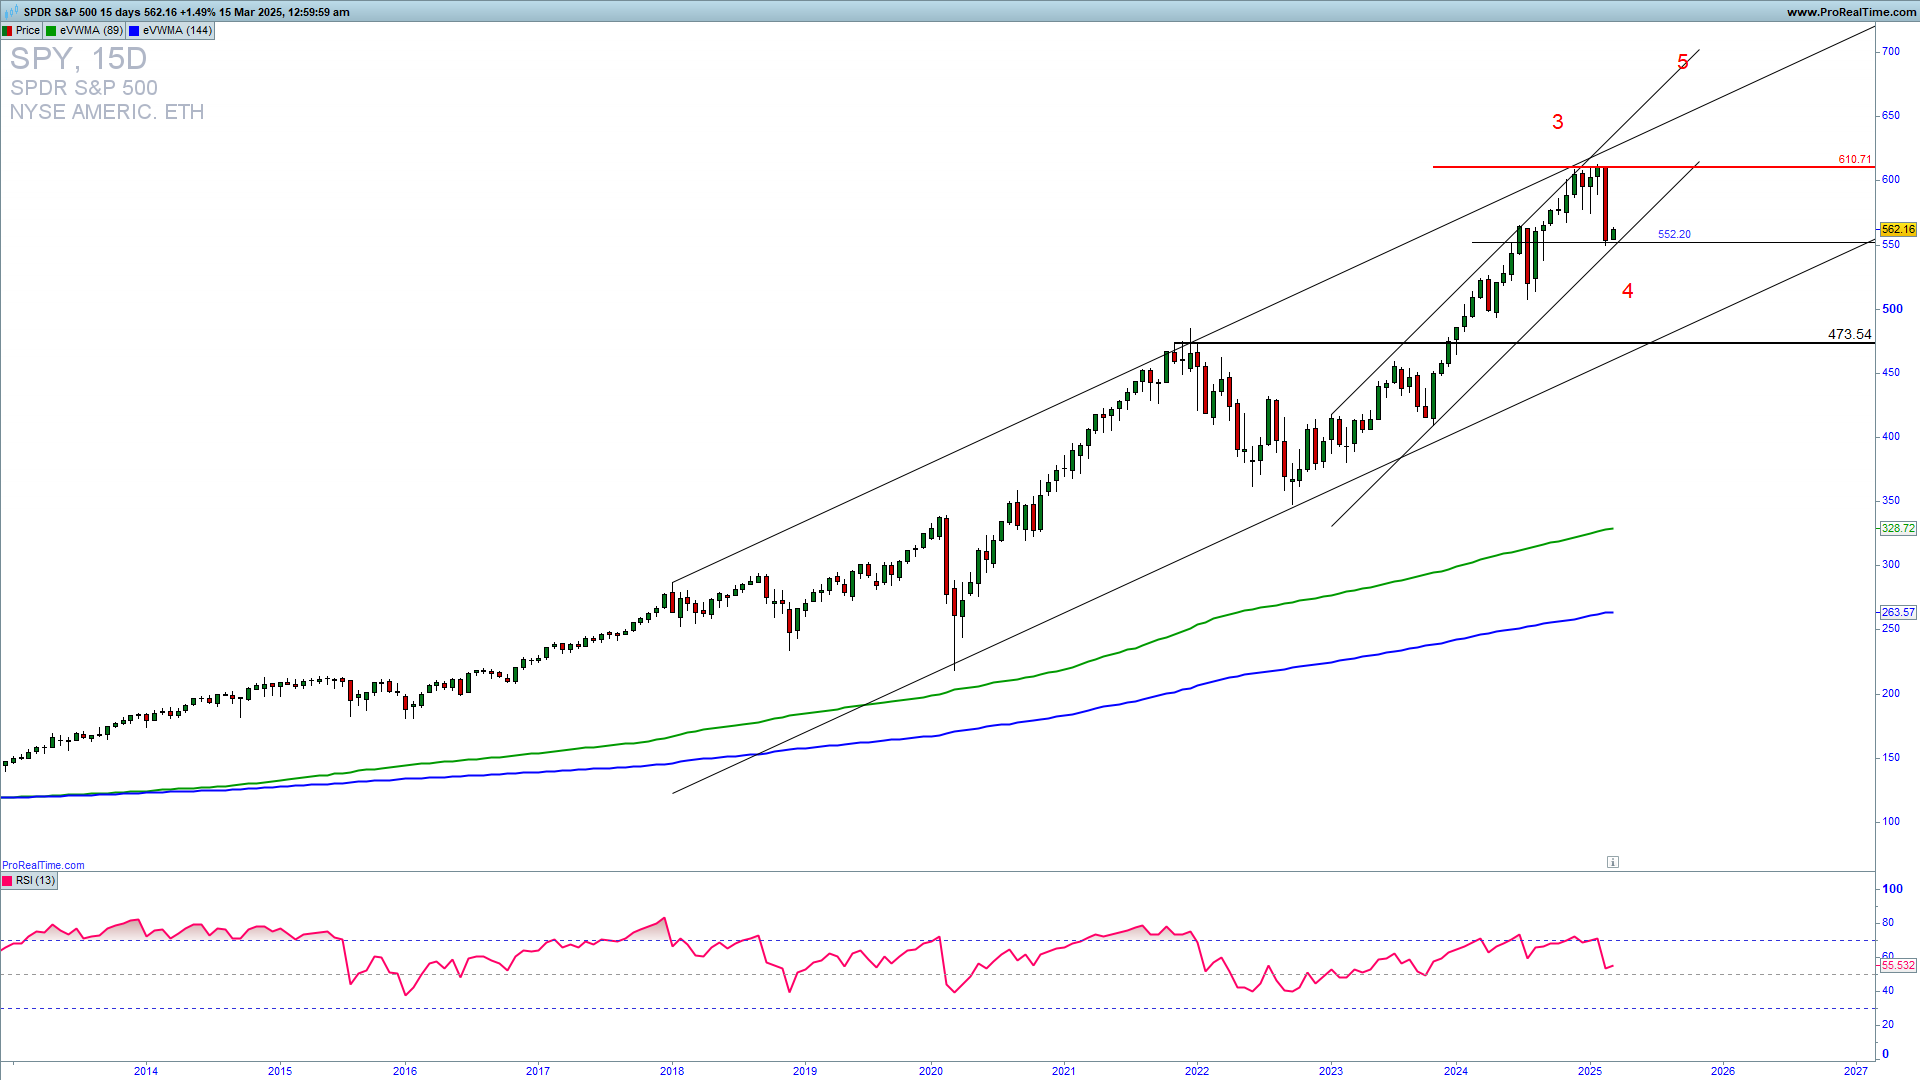
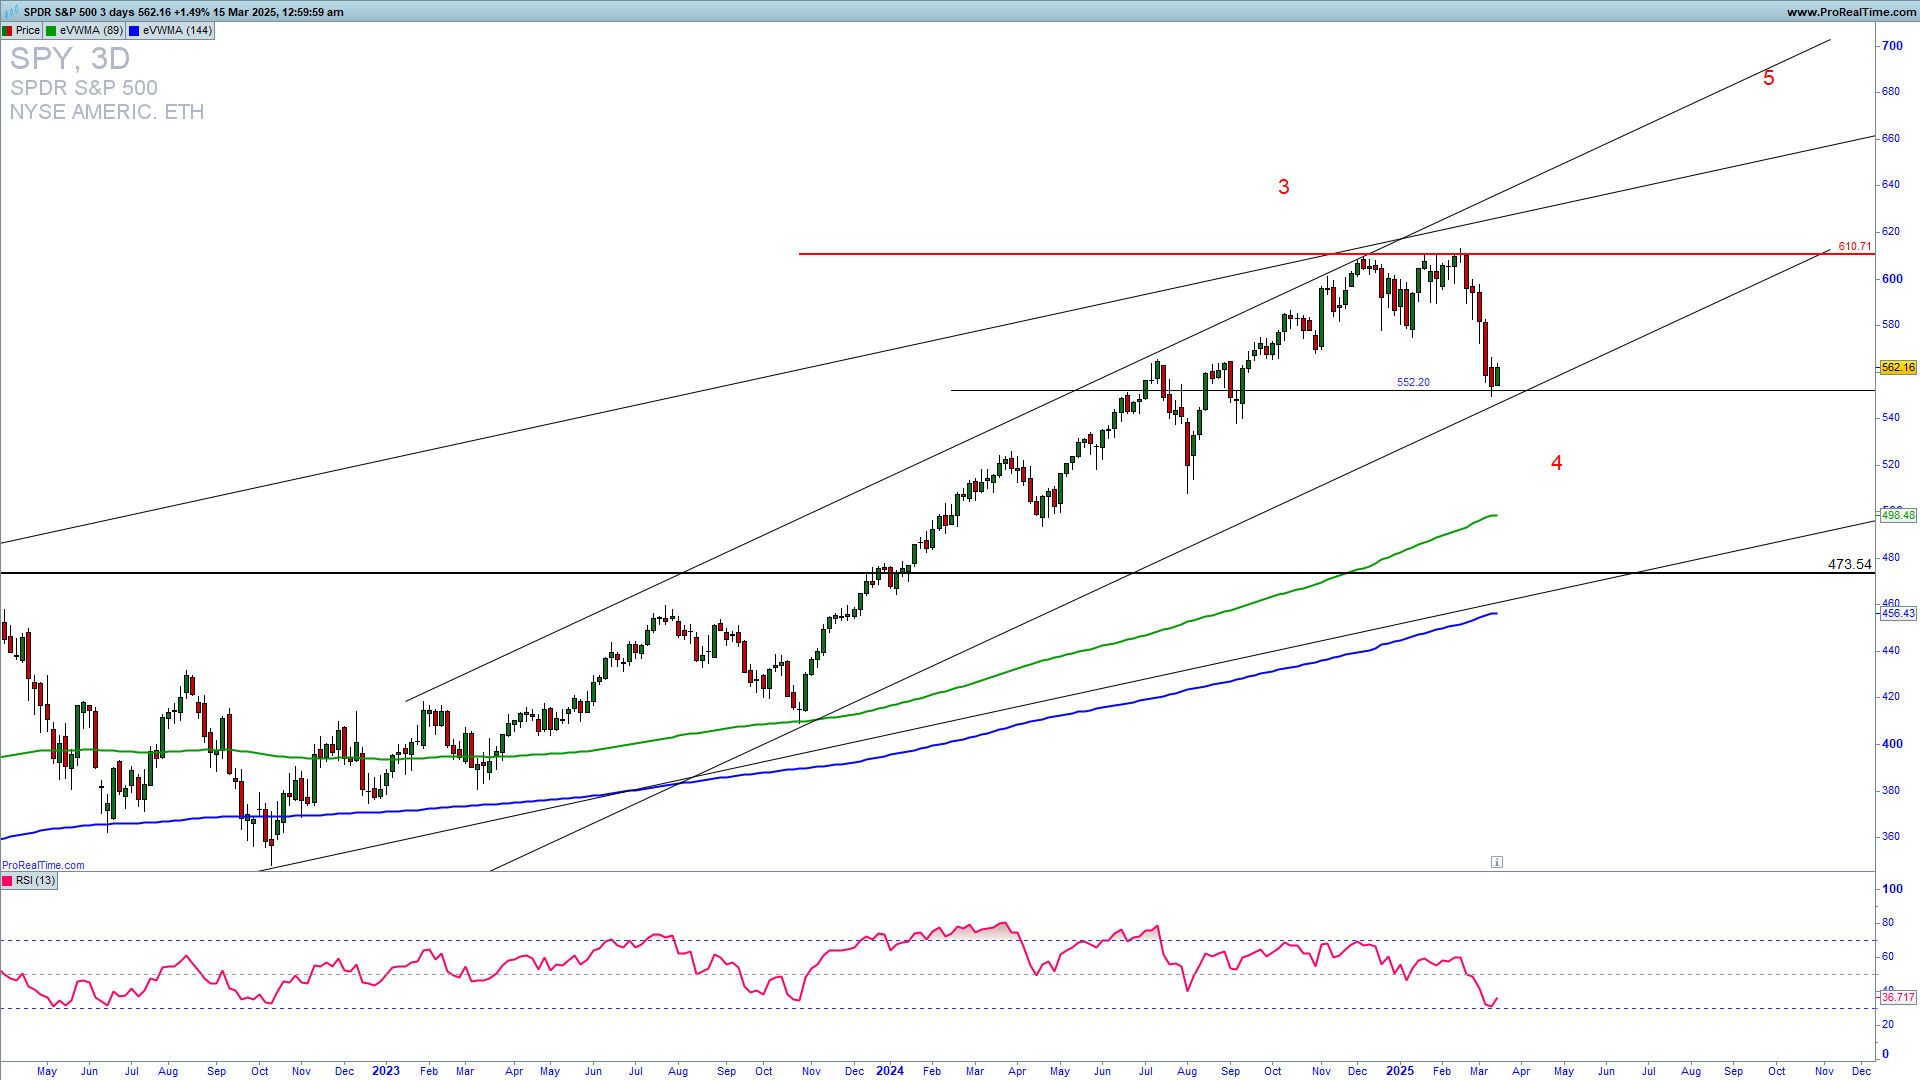
The SPY 3D charts below reveal an uptrend line test and bounce. At this point,  buy positions have a greater probability of success. If we get a confirmed break above 560, we should see an acceleration higher for a 610 test. The invalidation of an immediate extension higher will come upon a break below 550. 

GET THE TRADE SETUPS THREE DAYS A WEEK IN YOUR INBOX
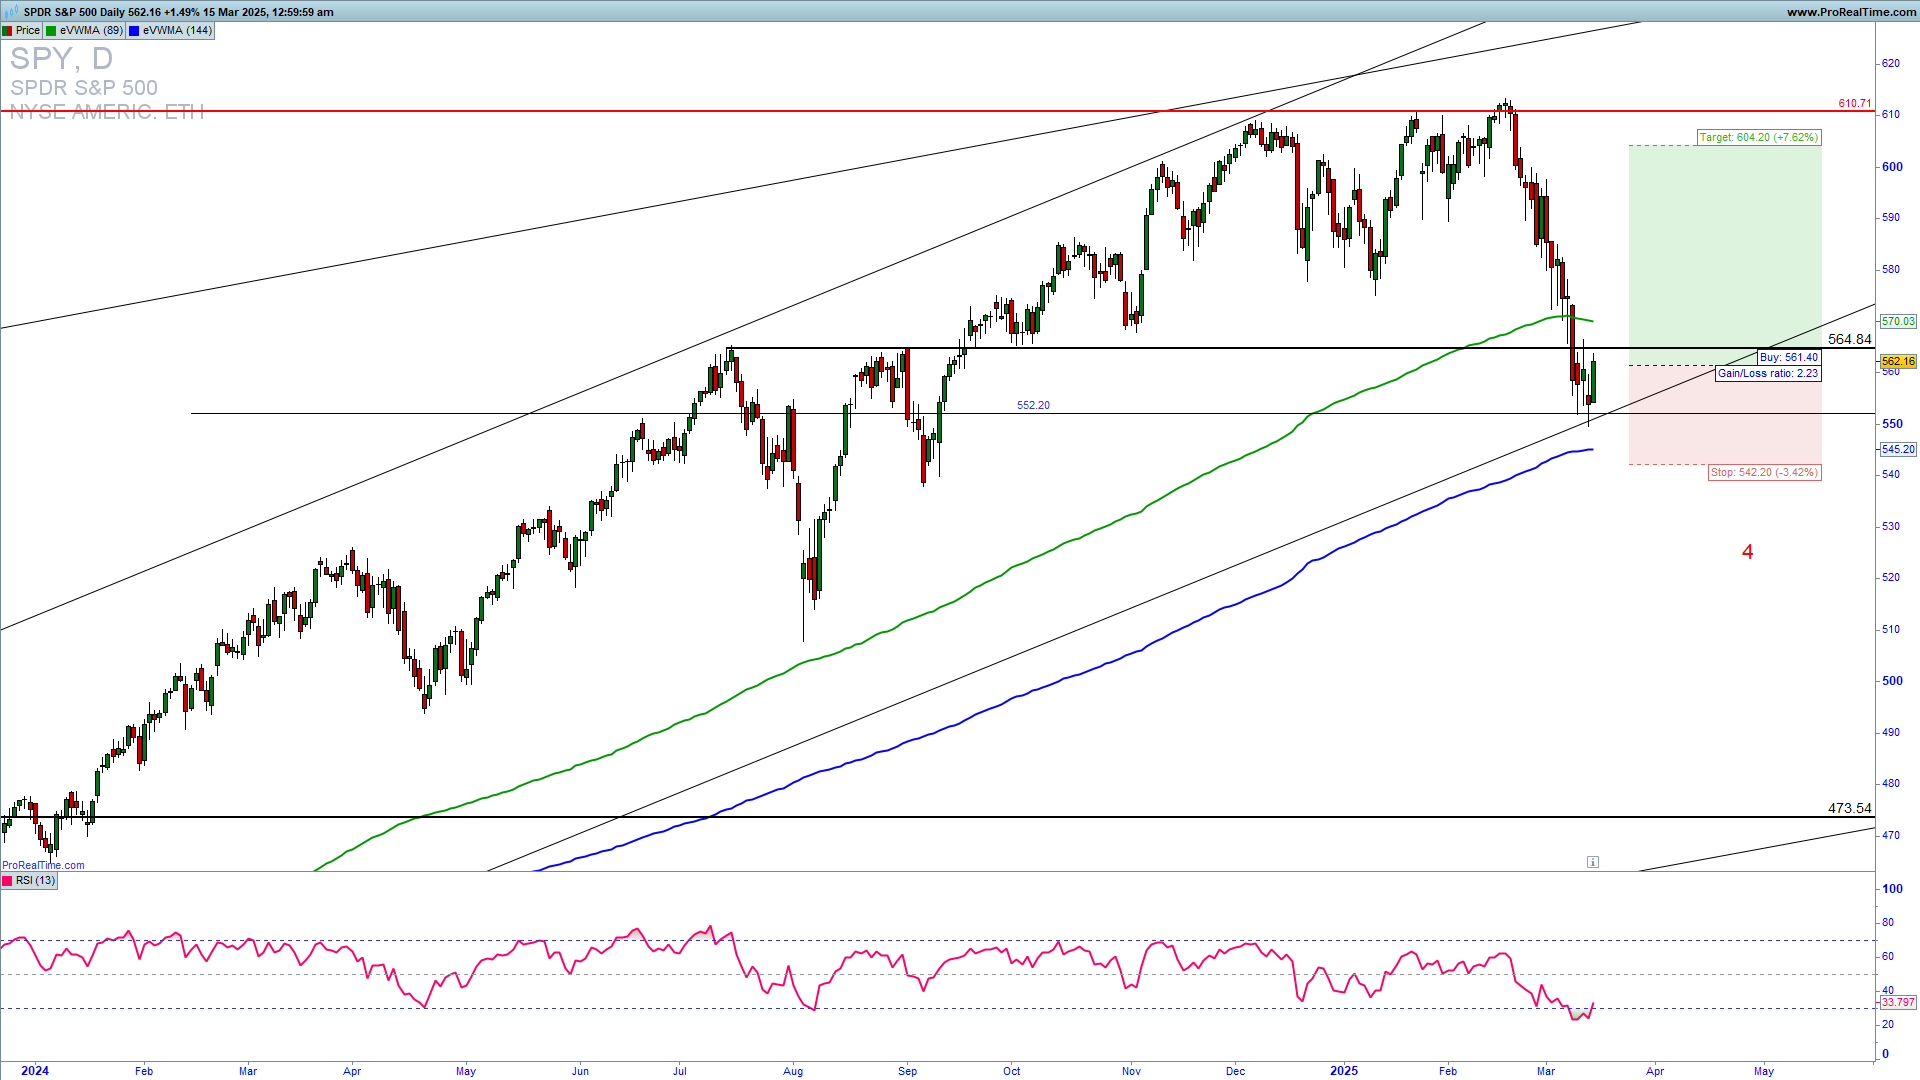
SPY 3 days chart


How to trade this?


PRIVATE TRADING COMMUNITY 4 WEEKS INTRO ACCESS 20 EUR! LIMITED OFFER! 


It is a fact that a strong downside support for Q1 2025 is 550 and If we get a confirmation of a breakout and a sustained extension below this level we could see a fast test of 470 which is a medium-term strong support. You can take the long trade here with a stop loss below 540.  For inquiries about account management or copy trading please write to [email protected] or contact me on WhatsApp or Live chat.

ThinkTrader web


OPTIONS TRADING TRAINING DISCOUNTED 


Leave a Comment

Scroll to Top