
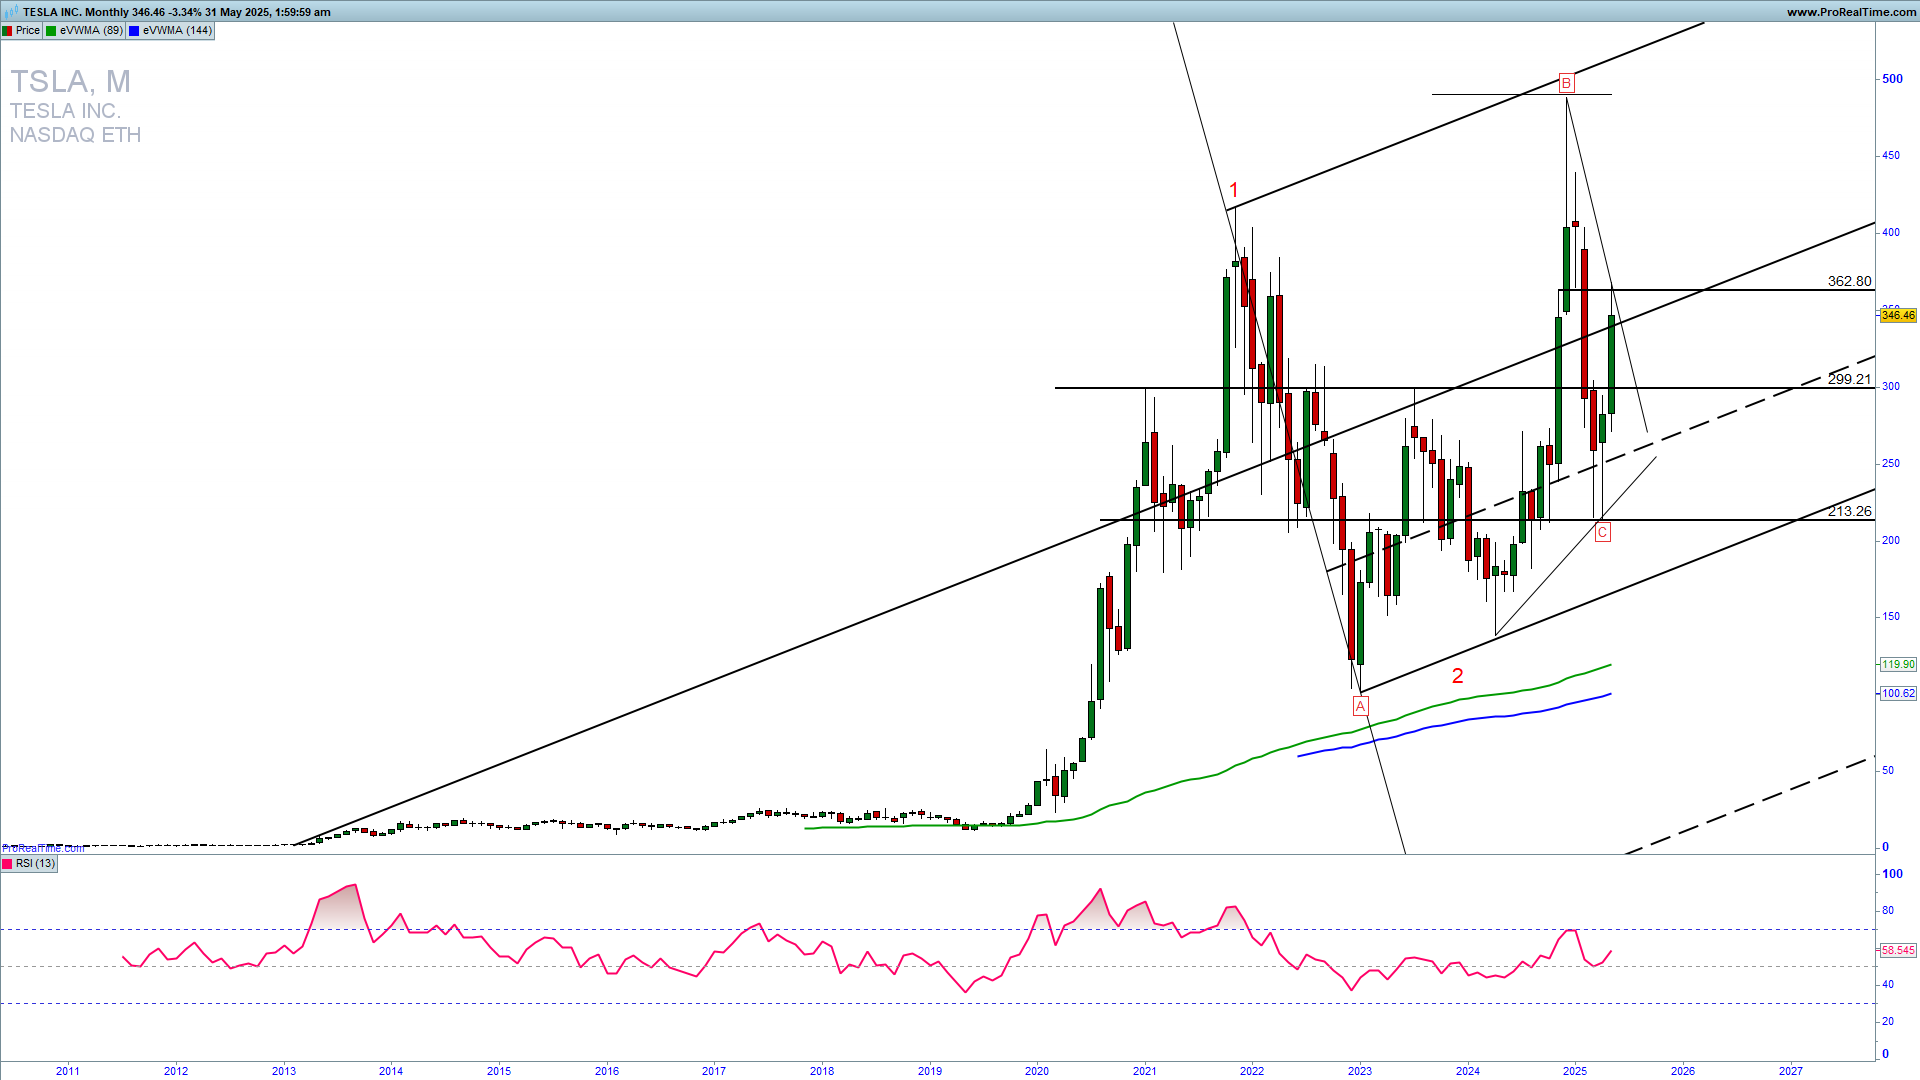
TSLA entered a long-term triangle consolidation, and we can now see a range trading between 360 and 230 in the next weeks and months. For a continuation higher, we need to see a clear confirmed break above 370. Learn to Trade stocks profitably.
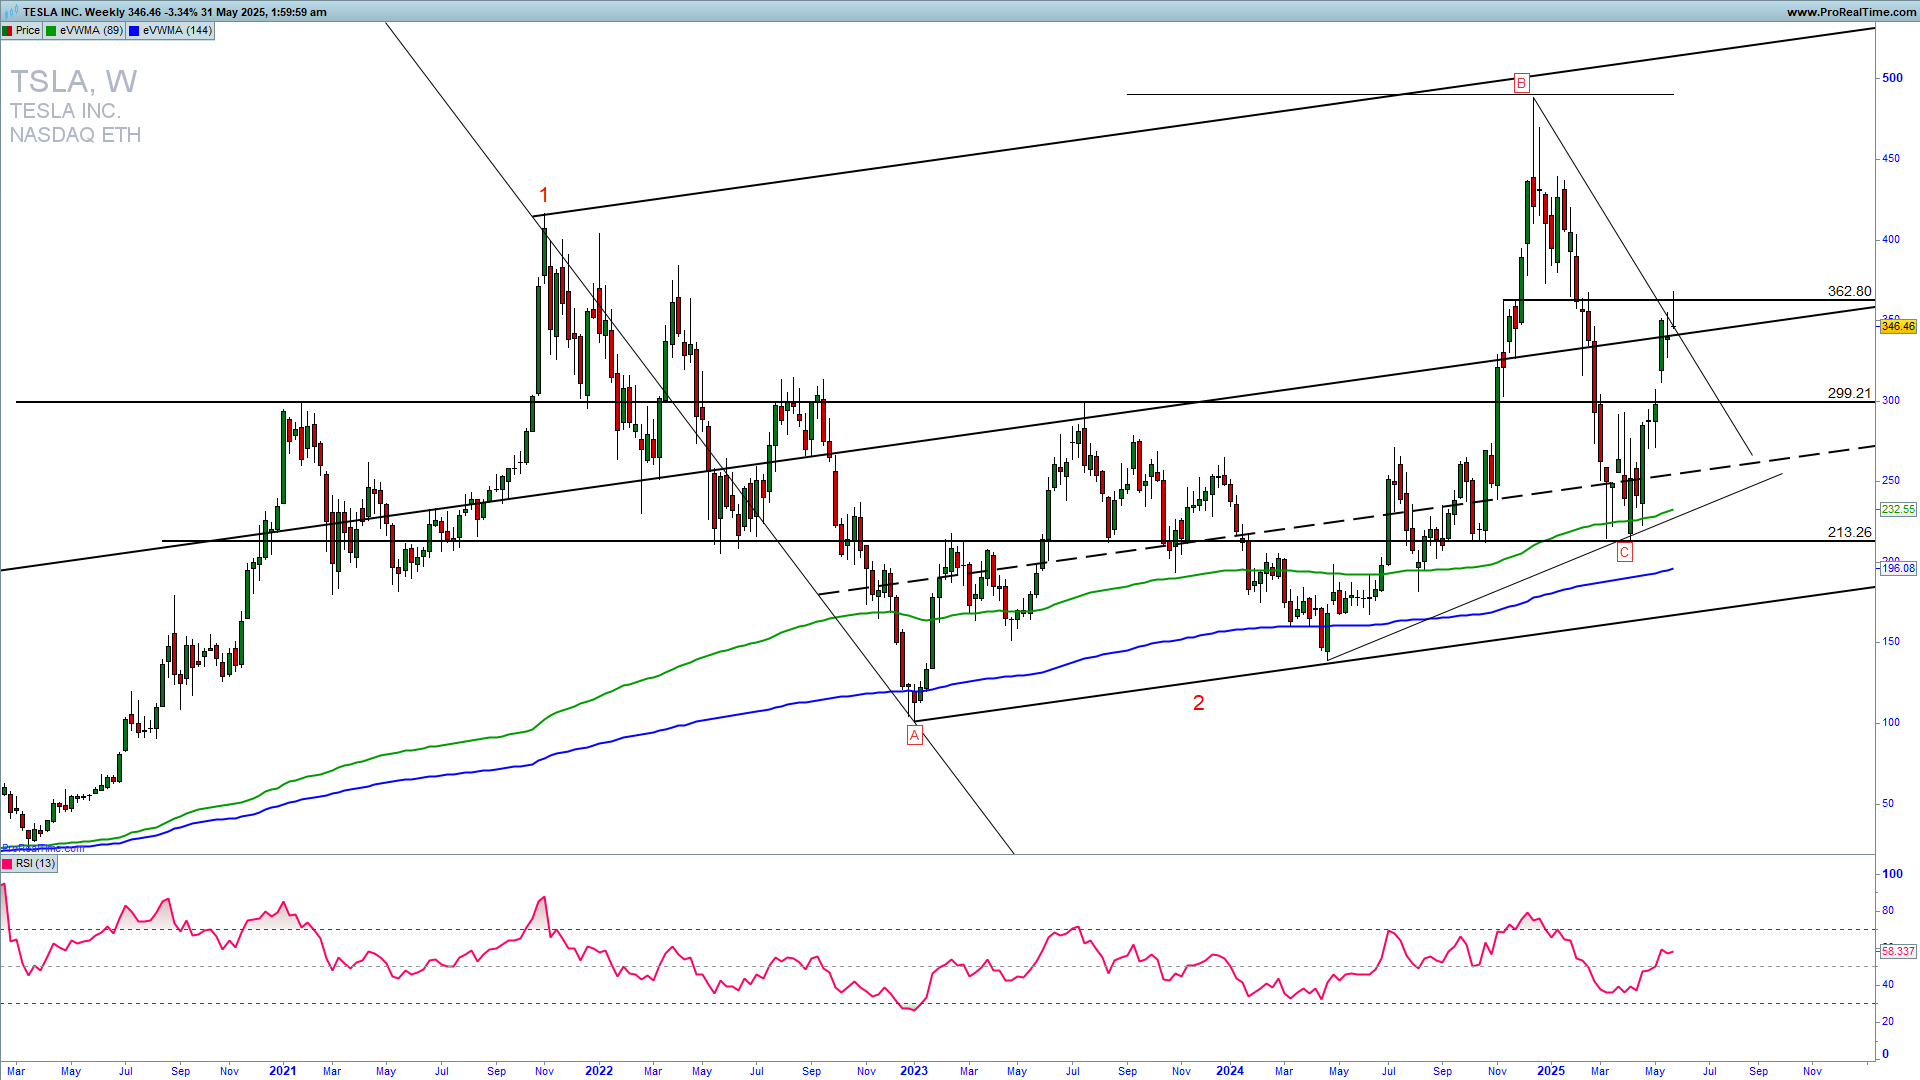
The TSLA weekly chart is revealing a strong resistance of 370 and that is a potential triangle top. We are seeing a strong rejection here which indicates a possible consolidation swing lower as it is mentioned on the monthly chart analysis. First support is 300 follows by 230. TSLA remains fragile and affected by the owner enrolment in US administration. Despite the new info that he is stepping down and will be fully committed to his company, volatility will be expected.
GET TRADE SETUPS IN YOUR INBOX
How can we trade this?
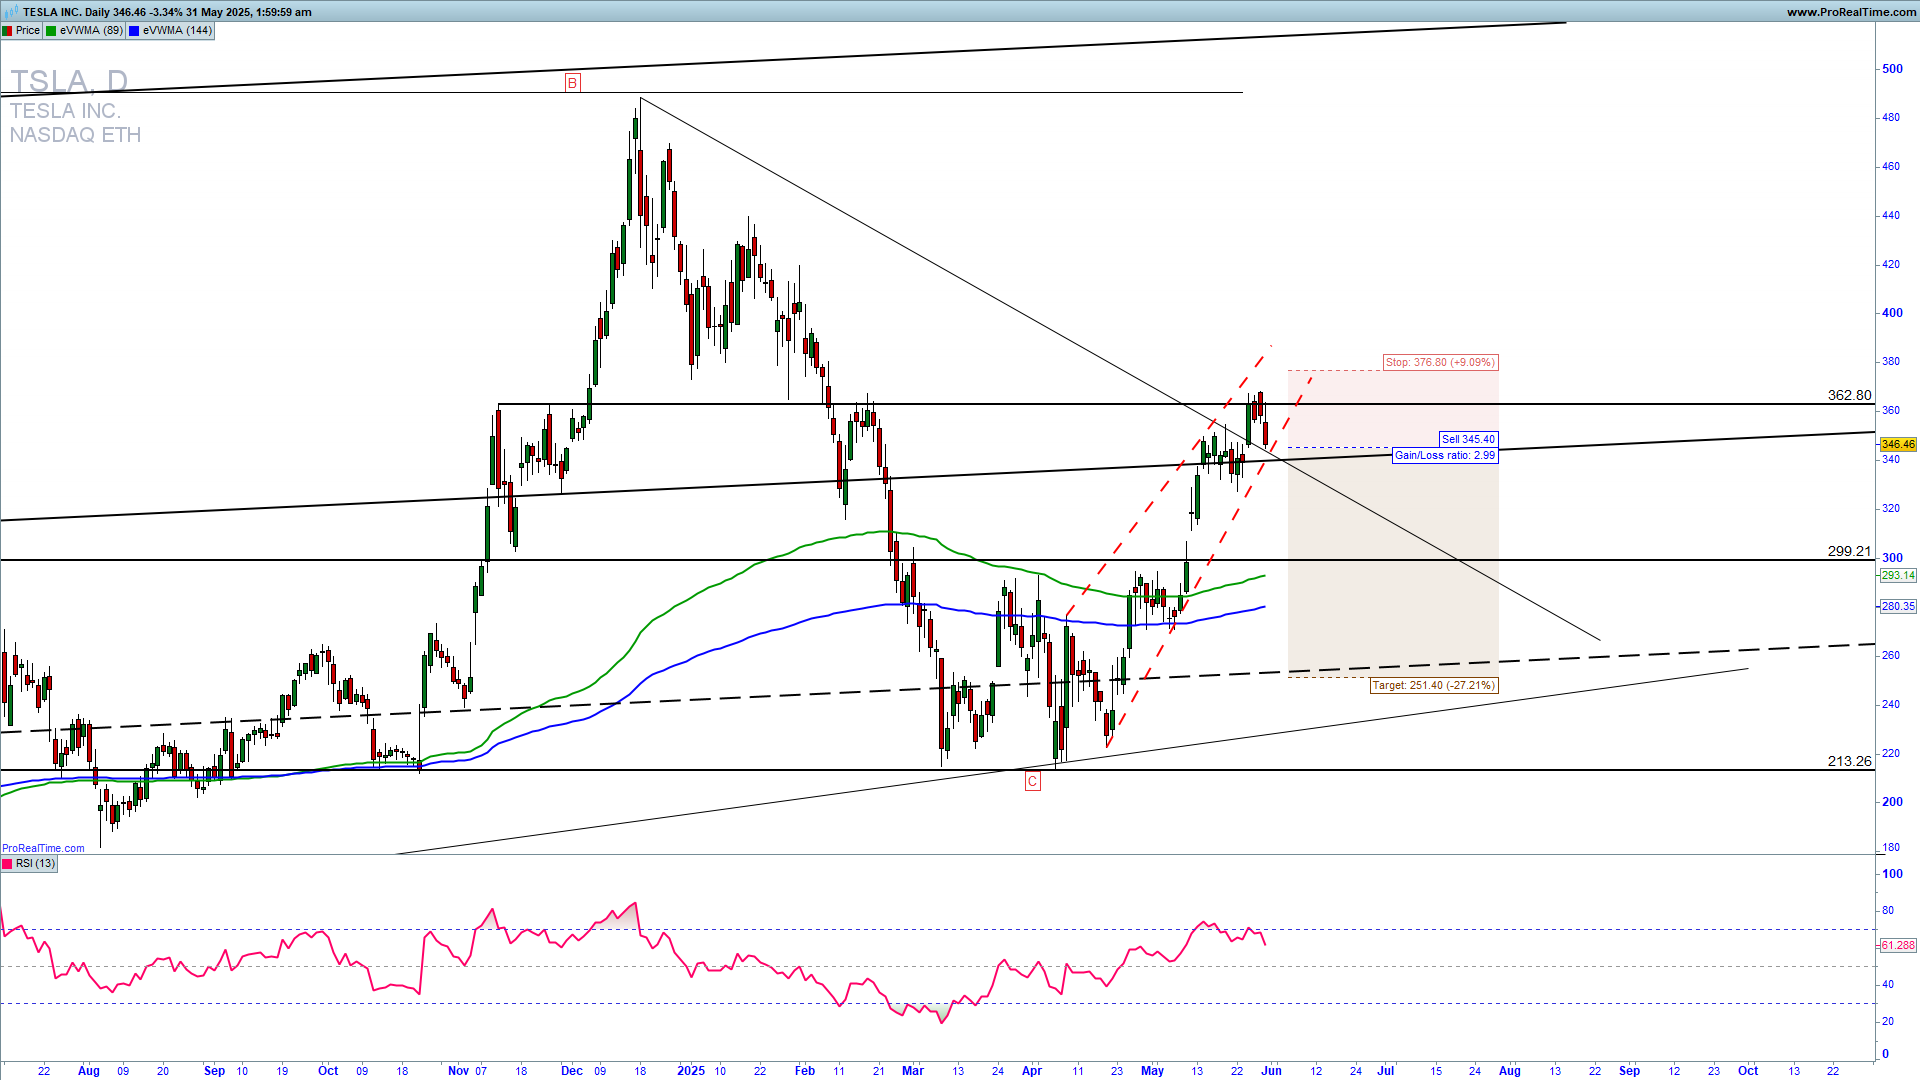
It is a fact that a strong upside resistance for Q2 2025 is 370, and if we get a confirmation and a sustained extension above it, we could see a strong upside continuation to 500. You can try with a short-trade entry with SL above 380 as the consolidation will continue. If the SL will be taken reverse to a long trade entry. For inquiries about account management or copy trading, please write to [email protected] or contact me on WhatsApp or Live chat.
OPTIONS TRADING TRAINING DISCOUNTED